Timeline
Mermaid Timeline Syntax
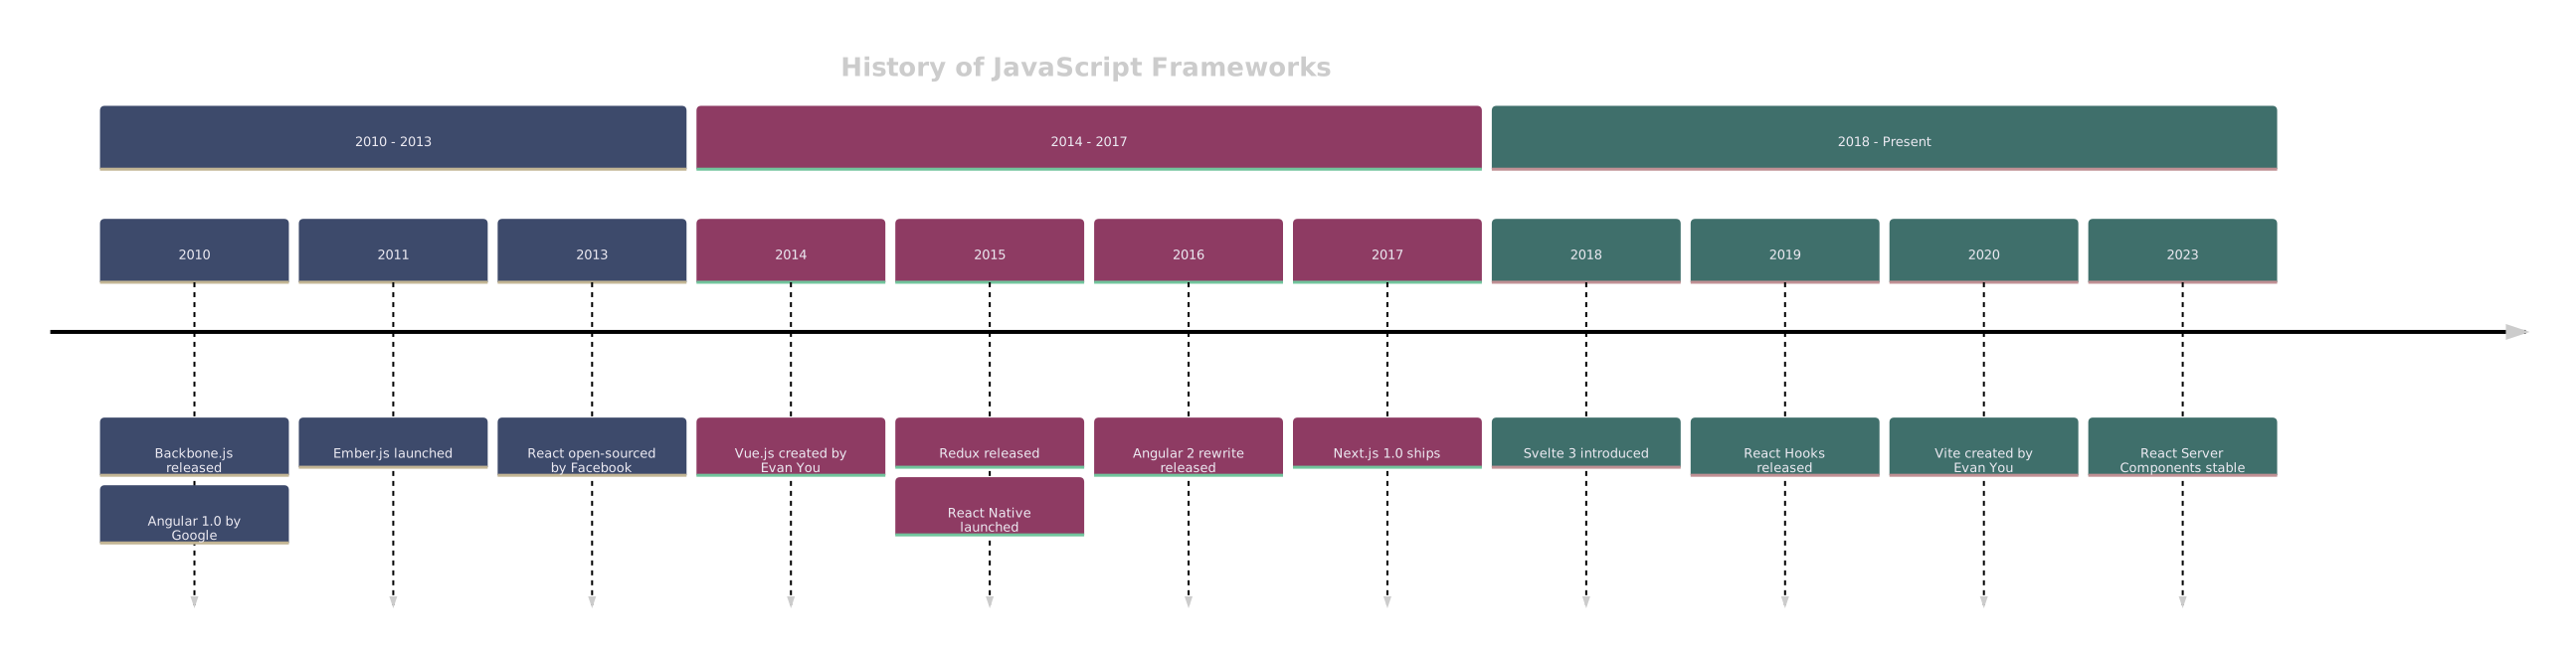
A timeline diagram lays out events or milestones in chronological order along a single axis, optionally grouped into sections. It is a straightforward way to show a history, a roadmap, or a sequence of releases as it unfolds over time.
A timeline is just a list of periods and the events inside them. Write them as plain text, one per line, and the diagram lays itself out — no dragging, no snapping to a grid.
Last updated: · Mermaid v11
Try it live
When to use timeline
Product history
Document the evolution of your product, key releases, and major milestones as a timeline that reads top to bottom. Adding this quarter to it is one line in the same file.
Technical roadmaps
Communicate planned phases to engineering teams and stakeholders with periods as sections and colon-separated events. Coarse enough to survive contact with reality, precise enough to align a quarter.
README documentation
Add visual history to open-source READMEs to show growth and maturity. A timeline of versions and milestones tells newcomers the project is alive better than any badge.
Key syntax
timelineDeclare diagram typetitle My TimelineOptional titlesection Period NameGroup events into periodsdate : eventAdd an event (date is any string) : another eventMultiple events on same dateHow to create a timeline with Mermaid
Open FlowViz and type timeline.
Add a title: title My Timeline Title.
Optionally group events with section Period Name.
Add events: date : Event description (date can be any string like "2024 Q1").
Add multiple events on the same date by repeating the pattern with the same date.
Events are displayed chronologically in the order you write them.
Export as SVG for use in presentations or documentation.
Frequently asked questions
What is the difference between a timeline and a Gantt chart?
A timeline marks *when* things happened: points in time, optionally grouped into periods, with no notion of how long anything took. A Gantt chart shows *how long* things take and how they overlap, with start dates, durations and dependencies between tasks. Use a timeline for history and milestones you are recording; use a Gantt chart for work you are planning.
What is a timeline diagram used for?
Chronological storytelling: product histories, project milestones, and roadmaps laid out period by period.
How do I group periods in a timeline?
section groups entries under a heading; each line inside is period : event.
Can one period have multiple events?
Yes — add another : event on the following lines and they stack under the same period.
Related tools
Start diagramming now
No signup. No install. Just open the editor and start writing.