Gantt Chart
Free Online Gantt Chart Maker
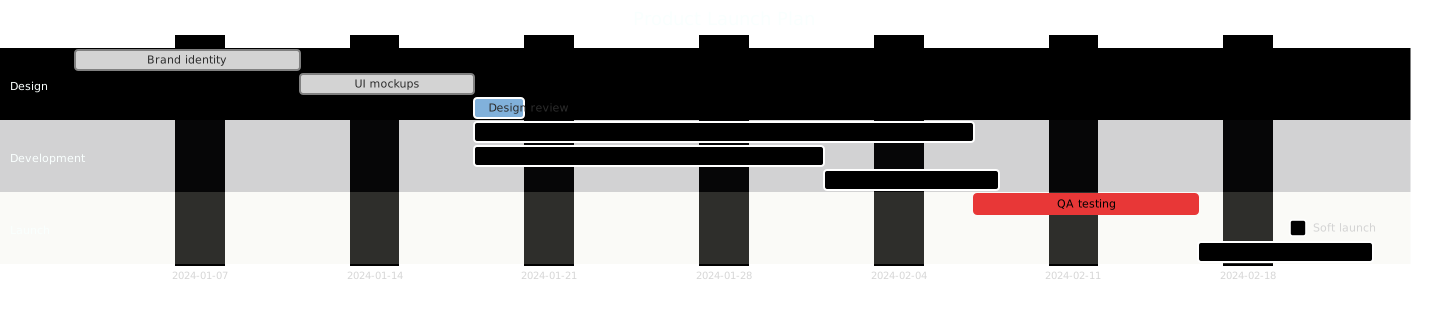
A Gantt chart is a type of bar chart that shows a project schedule: each horizontal bar is a task, its position marks when the task starts and ends, and its length shows how long the task takes. Gantt charts also show dependencies between tasks and group related tasks into sections.
Plan projects, sprints, and roadmaps with Mermaid Gantt charts. Write your schedule as code and preview it instantly.
Last updated: · Mermaid v11
Try it live
When to use gantt chart
Sprint planning
Lay out sprint tasks, dependencies, and capacity in a chart the whole team can read in the sprint doc. Status tags like done, active, and crit make progress visible without opening a project tool.
Product roadmaps
Communicate quarterly plans and feature timelines to stakeholders, with sections per quarter and milestone markers for launches. Because it is text, the roadmap updates in the same PR as the plan change.
Project management
Track milestones, deadlines, and phase dependencies for any project. The after keyword encodes the dependency chain, so a slipping task visibly pushes everything that waits on it.
Key syntax
dateFormat YYYY-MM-DDSet the date formatsection NameGroup tasks into sectionsTask :id, date, durationDefine a taskafter idStart after another taskdoneMark task as completedactiveMark task as in progresscritMark task as criticalmilestoneAdd a milestone markerexcludes weekendsSkip weekends in schedulingHow to create a gantt chart with Mermaid
Open FlowViz and start with gantt on the first line.
Set the title: title My Project Timeline.
Set the date format: dateFormat YYYY-MM-DD.
Create sections with section Section Name.
Add tasks: TaskName :id, start-date, duration (e.g. 7d for 7 days).
Use after id to create task dependencies.
Mark status with done, active, or crit before the task ID.
Add milestones with :milestone, date, 0d.
Frequently asked questions
How do I exclude weekends and holidays?
Add an `excludes` directive to the chart — `excludes weekends` for the common case, or specific dates such as `excludes 2026-12-25`. Mermaid then skips those days when it calculates durations, so a five-day task starting on a Thursday finishes the following Wednesday rather than the Monday. Without it, every duration is counted in calendar days.
What is a Mermaid Gantt chart used for?
Sprint plans, project roadmaps, and schedules written as plain text — no spreadsheet or dedicated PM tool required.
How do I set task dates and durations?
dateFormat declares the input format, then each task takes a start date plus a duration like 5d, or starts relative to another task.
Can Gantt tasks depend on each other?
Yes — write after taskId and the task starts when the referenced task finishes.
Related tools
Start diagramming now
No signup. No install. Just open the editor and start writing.