Sankey Diagram
Free Online Sankey Diagram Maker
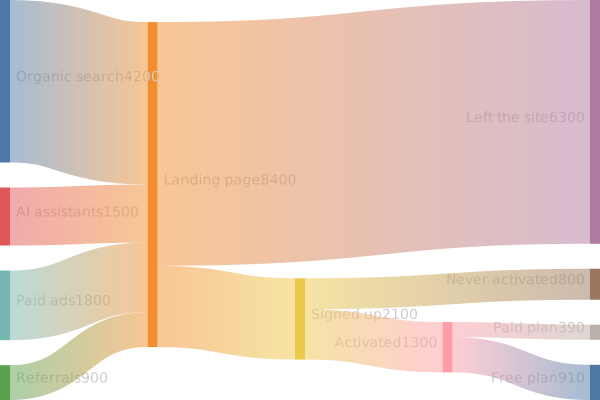
A sankey diagram shows flows between stages as bands whose width is proportional to the quantity they carry. It makes it easy to see where a total comes from, how it splits, and where most of it is lost, as in a signup funnel or an energy balance.
Each line is a flow: where it comes from, where it goes, and how much. Chain rows through shared names and the diagram draws every stage to scale.
Last updated: · Mermaid v11
Try it live
When to use sankey diagram
Conversion funnels
Show visitors from each channel moving through signup, activation and purchase, with the drop-off at every step drawn to scale.
Budgets and spending
Split income into departments and departments into cost lines. The diagram stays in step with the numbers because the numbers are the diagram.
Energy and material flows
Trace inputs through processes to outputs and losses, the classic use of a sankey diagram, from a few lines of CSV.
Key syntax
Experimental in Mermaid: its docs say the syntax, which is close to plain CSV, will be extended. Mermaid 11.10 and later also accept plain sankey, but sankey-beta works in every Mermaid version that has this diagram, including the older ones some sites and apps still run.
sankey-betaDeclare the diagram (Mermaid 11.10+ also accepts sankey)Source,Target,10One flow: source, target, valueB,C,4Reuse a name to chain stages"A, B",C,2Quote names that contain commasHow to create a sankey diagram with Mermaid
Open the FlowViz editor and type sankey-beta on the first line.
Leave a blank line, then add one flow per line: source,target,value.
Do not indent the rows. They are read as CSV.
Reuse a node name as the source of later rows to add stages.
Check the bands: each is drawn in proportion to its value.
Export as SVG or PNG, or copy a share link.
Frequently asked questions
What is a sankey diagram used for?
Showing how a quantity flows from sources to destinations and where it splits or drops off: website funnels, energy use, budgets, or material flows. The width of each band is proportional to its value.
What format does the data use?
One flow per line as CSV: source,target,value, with no indentation. A node that appears as a target in one row and a source in another becomes a middle stage.
Can node names contain commas?
Yes, if you wrap the name in double quotes, as in CSV: "Sales, EMEA",Revenue,120.
Is the sankey diagram syntax stable?
Mermaid still describes the sankey diagram as experimental, so details may change. The basic CSV rows have worked the same way since it was introduced.
Start diagramming now
No signup. No install. Just open the editor and start writing.